Logging, Metrics, and Tracing: Understanding Application Observability
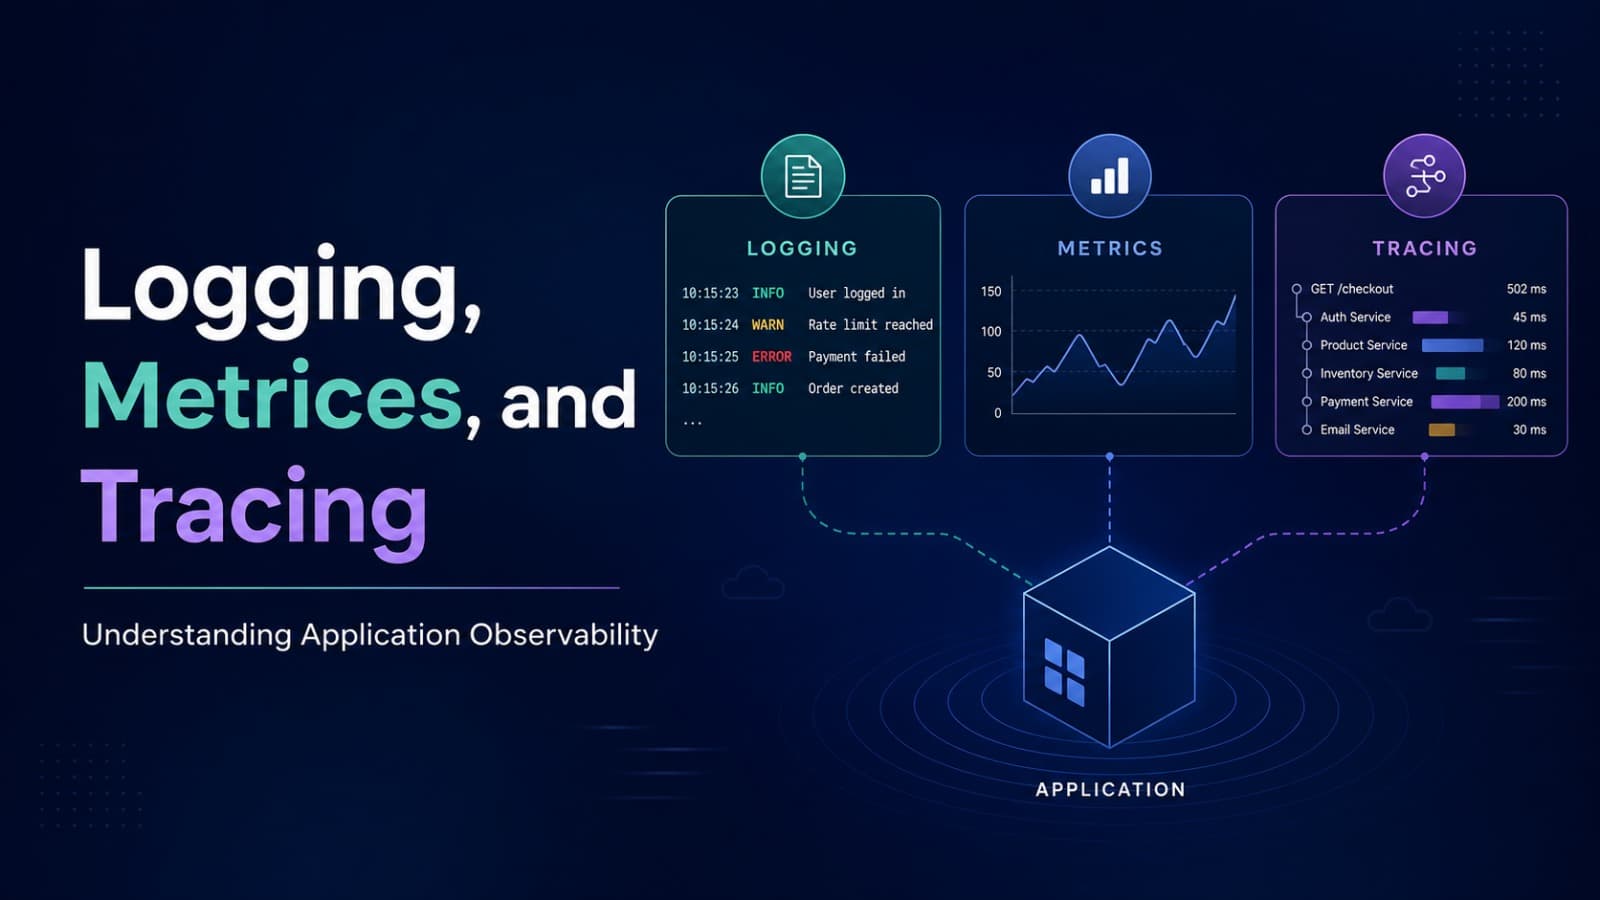
Logging, Metrics, and Tracing: Understanding Application Observability
Imagine you've deployed your backend application. Everything works perfectly during development, but after a few days, users start reporting problems:
- Some API requests are taking too long.
- A few users cannot complete their transactions.
- Your server occasionally returns errors.
- You don't know which part of the application is causing the problem.
You open your server and see that the application is running. But that doesn't tell you whether everything is actually working correctly.
This is where observability becomes important.
Observability helps developers understand what is happening inside an application by examining the information it produces.
In this article, we'll explore three important concepts:
- Logging: What happened?
- Metrics: How is the application performing?
- Tracing: Where did a request spend its time?
We'll understand each concept with beginner-friendly examples and see how they work together in a backend application.
1. What Is Observability?
Observability is the ability to understand the internal state and behavior of a system by examining the information it produces.
In simple words:
Observability helps you understand why your application is behaving in a particular way.
Consider an e-commerce application with the following components:
- Mobile application
- Backend API
- Authentication service
- Payment service
- Database
A customer places an order, but the payment fails.
Without observability, you might only know that the payment failed.
With observability, you can investigate:
- Which API request failed?
- When did the failure happen?
- Which service returned the error?
- How long did the payment service take?
- Was the database responding slowly?
- Did other requests experience the same problem?
Observability gives developers the information needed to investigate these questions.
A simple example
Imagine your backend has an endpoint:
POST /ordersA user sends a request to create an order.
The request travels through several components:
Scroll to zoom · Drag to pan
If the request takes 8 seconds instead of 500 milliseconds, observability helps you identify where the delay occurred.
Instead of guessing, you investigate using actual application data.
2. Monitoring vs Observability
Monitoring and observability are related, but they are not exactly the same.
Monitoring
Monitoring means continuously checking predefined conditions to understand whether an application is healthy.
For example:
- Is the server running?
- Is CPU usage above 90%?
- Are API errors increasing?
- Is database storage almost full?
- Is the API responding within an acceptable time?
Monitoring is useful for detecting known problems.
Observability
Observability helps investigate problems, including unexpected issues that you did not specifically create an alert for.
For example:
Your monitoring system tells you that API response times have increased.
Observability helps you investigate why:
- Is the database slow?
- Is one external API unavailable?
- Is a particular endpoint taking too long?
- Is the application waiting for another service?
Comparison
| Monitoring | Observability |
|---|---|
| Detects known problems | Helps investigate problems |
| Uses predefined checks and alerts | Uses logs, metrics, traces, and context |
| Answers whether something is wrong | Helps explain why something is wrong |
| Often focuses on system health | Examines application behavior |
Monitoring is an important part of an observability strategy.
They work together rather than replacing each other.
3. The Three Pillars of Observability
The three commonly discussed pillars of observability are:
- Logs
- Metrics
- Traces
Each provides a different view of the application.
Scroll to zoom · Drag to pan
Let's understand them one by one.
4. Understanding Logs
A log is a recorded event produced by an application.
Whenever something important happens, an application can write a log message.
For example:
- A user successfully logs in.
- A payment request fails.
- A database connection is established.
- An API request takes too long.
- An unexpected exception occurs.
Logs help developers understand what happened and when it happened.
Example of a simple log
Imagine a user logs into your application.
The backend might produce:
User login successfulIf authentication fails:
Invalid password for userThese messages provide useful information about application behavior.
Log levels
Most applications use different log levels to indicate the importance of a message.
| Level | Meaning | Example |
|---|---|---|
| DEBUG | Detailed information for debugging | Database query parameters |
| INFO | Normal application events | Server started successfully |
| WARNING | Something unexpected happened | API response is unusually slow |
| ERROR | An operation failed | Payment request failed |
| CRITICAL | A serious failure occurred | Application cannot continue |
Logging in Python
Python provides a built-in logging module.
You don't need to install another package to use it.
Create a file named main.py:
import logging
from fastapi import FastAPI

logging.basicConfig(
    level=logging.INFO,
    format="%(asctime)s - %(levelname)s - %(message)s"
)

logger = logging.getLogger(__name__)

app = FastAPI()


@app.get("/")
def home():
    logger.info("Home endpoint was requested")

    return {
        "message": "Hello, FastAPI!"
    }


@app.get("/error")
def example_error():
    logger.error("An example error occurred")

    return {
        "message": "Check the server logs"
    }
Run the application:
fastapi dev main.pyVisit:
http://127.0.0.1:8000/Look at your terminal. You should see the log messages generated by your application.
Why use logging instead of print()?
Beginners often use print() to debug applications.
For example:
print("User logged in")This works for simple experiments, but it becomes difficult to manage in larger applications.
Logging provides:
- Different severity levels.
- Consistent formatting.
- Configurable output destinations.
- Integration with log collection systems.
- Better control over production logging.
Use print() for quick experiments, but use a proper logging system in real applications.
What is structured logging?
A traditional log might look like this:
ERROR Payment failed for order 123A structured log stores information in a predictable format, commonly JSON:
{
  "level": "ERROR",
  "event": "payment_failed",
  "order_id": "123",
  "service": "payment-api"
}
Structured logs are easier for log management tools to search, filter, and analyze.
For example, you can search for all payment failures or filter logs belonging to a particular order.
Important: Never log passwords, authentication tokens, private API keys, or sensitive personal information.
5. Understanding Metrics
Metrics are numerical measurements that describe the performance and health of an application over time.
While logs tell you what happened, metrics help you understand how your application is performing.
For example:
- How many requests are received per second?
- How many requests are failing?
- What is the average API response time?
- How much memory is the application using?
- How many database connections are active?
Example of application metrics
Imagine your API receives 10,000 requests in one hour.
You might collect these measurements:
Total requests: 10,000
Successful requests: 9,700
Failed requests: 300
Average response time: 180 ms
CPU usage: 45%
Memory usage: 62%
These numbers help you understand the overall health of your application.
Important metric types
Prometheus commonly uses four main metric types.
1. Counter
A counter is a cumulative value that increases over time.
Example:
Total HTTP requests: 1000After another request:
Total HTTP requests: 1001Counters are useful for measuring:
- Total requests
- Total errors
- Successful payments
- Failed login attempts
A counter normally resets when its application process restarts.
2. Gauge
A gauge represents a value that can increase or decrease.
Examples:
CPU usage: 45%
Memory usage: 62%
Active connections: 25
Gauges are useful for measuring current conditions.
3. Histogram
A histogram records observations in configurable buckets and also tracks the count and sum of observations.
It is commonly used to measure request duration.
For example:
Request duration:
- Up to 100 ms: 100 requests
- Up to 500 ms: 450 requests
- Up to 1 second: 300 requests
- Up to 5 seconds: 150 requests
Histograms help you understand how response times are distributed.
4. Summary
A summary also records observations and can calculate configured quantiles, depending on the implementation.
It is another way to analyze values such as request durations.
Histograms are often preferred when latency needs to be aggregated across multiple application instances.
Understanding latency percentiles
Average response time doesn't always tell the complete story.
Imagine these response times:
100 ms
120 ms
130 ms
150 ms
200 ms
2500 ms
The average might look reasonable, but one request took 2.5 seconds.
This is why developers often examine percentiles.
| Percentile | Meaning |
|---|---|
| p50 | 50% of requests completed within this time |
| p90 | 90% of requests completed within this time |
| p95 | 95% of requests completed within this time |
| p99 | 99% of requests completed within this time |
For example:
p50 = 120 ms
p95 = 450 ms
p99 = 1200 ms
This means 95% of requests completed within approximately 450 milliseconds.
Percentiles are especially useful when investigating slow requests that averages can hide.
What is Prometheus?
Prometheus is an open-source monitoring and metrics collection system.
It collects numerical metrics from applications and infrastructure.
A simplified workflow looks like this:
Scroll to zoom · Drag to pan
Prometheus commonly scrapes an application's metrics endpoint at regular intervals.
For example:
http://localhost:8000/metricsThe endpoint exposes numerical measurements in a format Prometheus understands.
Add Prometheus metrics to FastAPI
Install the integration:
python -m pip install prometheus-fastapi-instrumentatorUpdate main.py:
from fastapi import FastAPI
from prometheus_fastapi_instrumentator import Instrumentator

app = FastAPI()

Instrumentator().instrument(app).expose(app)


@app.get("/")
def home():
    return {
        "message": "Hello, FastAPI!"
    }


@app.get("/users")
def get_users():
    return {
        "users": ["Manjit", "Alex"]
    }
Start the application:
fastapi dev main.pyOpen:
http://127.0.0.1:8000/metricsYou should see Prometheus-formatted metrics.
Make a few requests to your API and inspect the metrics again.
The integration automatically collects useful HTTP metrics, including request counts and duration measurements.
For a production deployment, configure the exposed metrics endpoint and network access carefully. You generally don't want monitoring data to be publicly accessible without protection.
6. Understanding Distributed Tracing
Logs and metrics provide useful information, but they don't always show the complete journey of an individual request.
This is where distributed tracing becomes useful.
A trace follows a request as it travels through different components of an application.
Imagine an e-commerce application with multiple backend services.
A customer places an order.
The request passes through:
- API Gateway
- Authentication Service
- Order Service
- Payment Service
- Database
If the request takes 4 seconds, which component caused the delay?
Distributed tracing helps answer that question.
Example request flow
Scroll to zoom · Drag to pan
A trace records information about the operations involved in handling the request.
What is a span?
A span represents one operation within a trace.
For example:
Trace: Create Order

Span 1: API Gateway       100 ms
Span 2: Authentication     50 ms
Span 3: Order Service     150 ms
Span 4: Payment Service  2500 ms
Span 5: Database          200 ms
Each span can contain:
- Operation name
- Start time
- Duration
- Attributes
- Status
- Parent-child relationships
The trace groups related spans together using a trace ID.
Visualizing a trace
A tracing interface often displays spans in a timeline called a waterfall view.
Scroll to zoom · Drag to pan
This simplified diagram illustrates sequential operations. Real distributed traces can contain overlapping operations, parallel requests, and nested spans.
By looking at the duration of each span, you can identify which operation is taking the most time.
What is OpenTelemetry?
OpenTelemetry is an open-source observability framework for generating, collecting, and exporting telemetry data.
It provides APIs, SDKs, and instrumentation libraries for collecting:
- Traces
- Metrics
- Logs
OpenTelemetry does not act as a complete monitoring dashboard by itself.
Instead, it helps applications generate and export telemetry to compatible observability platforms.
For example:
Scroll to zoom · Drag to pan
The collector is an optional component that can receive, process, and export telemetry to different systems.
This separation makes it easier to change your observability backend without rewriting your application's instrumentation.
7. How Logs, Metrics, and Traces Work Together
Now that we understand all three concepts, let's see how they help investigate a real issue.
Imagine users report that placing an order is taking too long.
Step 1: Metrics detect the problem
Your dashboard shows that API latency has increased.
Normal p95 latency: 250 ms
Current p95 latency: 3200 ms
This tells you that requests are taking longer than usual.
Step 2: Traces locate the problem
You inspect a slow request in your tracing platform.
The trace shows:
API Gateway:       100 ms
Authentication:     50 ms
Order Service:    150 ms
Payment Service: 2800 ms
Database:          100 ms
Now you know that the payment service is responsible for most of the delay in this request.
Step 3: Logs provide details
You search the payment service logs using the request or trace ID.
You discover:
WARNING Payment provider response took 2800 msThe logs provide additional context about what happened.
The complete workflow
Scroll to zoom · Drag to pan
This is why logs, metrics, and traces are more useful together than in isolation.
| Signal | Main question | Example |
|---|---|---|
| Logs | What happened? | Payment provider timed out |
| Metrics | How much or how often? | 20% of payment requests are failing |
| Traces | Where did it happen? | Payment service took 2.8 seconds |
8. Implement Observability in FastAPI
Let's combine a few concepts in a small FastAPI application.
We'll add:
- Application logging
- Request IDs
- Request duration measurement
- Prometheus metrics
Step 1: Install dependencies
python -m pip install "fastapi[standard]" prometheus-fastapi-instrumentatorStep 2: Create the application
Create main.py:
import logging
import time
import uuid

from fastapi import FastAPI, Request
from prometheus_fastapi_instrumentator import Instrumentator

logging.basicConfig(
    level=logging.INFO,
    format="%(asctime)s %(levelname)s %(name)s %(message)s"
)

logger = logging.getLogger("api")

app = FastAPI(title="Observable API")


@app.middleware("http")
async def request_observability(request: Request, call_next):
    request_id = str(uuid.uuid4())
    start_time = time.perf_counter()

    try:
        response = await call_next(request)

    except Exception:
        duration = time.perf_counter() - start_time

        logger.exception(
            "Request failed",
            extra={
                "request_id": request_id,
                "method": request.method,
                "path": request.url.path,
                "duration_seconds": duration
            }
        )

        raise

    duration = time.perf_counter() - start_time

    response.headers["X-Request-ID"] = request_id

    logger.info(
        "Request completed",
        extra={
            "request_id": request_id,
            "method": request.method,
            "path": request.url.path,
            "status_code": response.status_code,
            "duration_seconds": round(duration, 4)
        }
    )

    return response


@app.get("/")
def home():
    logger.info("Home endpoint called")

    return {
        "message": "Welcome to the observable API"
    }


@app.get("/slow")
async def slow_endpoint():
    import asyncio

    await asyncio.sleep(2)

    return {
        "message": "This endpoint took approximately two seconds"
    }


Instrumentator().instrument(app).expose(app)
Step 3: Run the application
fastapi dev main.pyTest these endpoints:
http://127.0.0.1:8000/
http://127.0.0.1:8000/slow
http://127.0.0.1:8000/metrics
What did we implement?
Logging: Each request produces a log message with information about the request.
Request ID: Every request receives a unique identifier in its response header. This can help locate related logs.
Duration measurement: time.perf_counter() measures how long the request took.
Metrics: The Prometheus integration exposes HTTP metrics at /metrics.
Important production considerations
This is a learning example, not a complete production observability setup.
- Use structured JSON logging when your log collection system needs machine-readable events.
- Configure request IDs carefully if accepting IDs from upstream services.
- Use a shared trace context when working across multiple services.
- Avoid logging sensitive data.
- Protect internal monitoring endpoints.
- Add distributed tracing with OpenTelemetry when you need request-level visibility across services.
Also note that a request ID and a distributed trace ID are not interchangeable. A request ID is useful for correlating logs, while a trace ID identifies a distributed trace and connects related spans.
9. Popular Observability Tools
Several tools help collect, store, visualize, and analyze observability data.
1. Prometheus
Prometheus is used to collect and store numerical metrics.
Common use cases:
- API request counts
- Request duration
- CPU and memory usage
- Error rates
- Infrastructure monitoring
Website: https://prometheus.io/
2. Grafana
Grafana helps visualize metrics and other data through dashboards.
You can create dashboards showing:
- API response times
- Error rates
- Server resource usage
- Database performance
- Request volume
Website: https://grafana.com/
3. OpenTelemetry
OpenTelemetry provides a vendor-neutral way to generate and export telemetry data.
It is commonly used for instrumenting applications and connecting them to observability platforms.
Website: https://opentelemetry.io/
4. Jaeger
Jaeger is a distributed tracing platform.
It helps developers visualize traces, inspect spans, and investigate latency across services.
Website: https://www.jaegertracing.io/
5. Loki
Grafana Loki is a log aggregation system designed to work with Grafana.
It helps collect and query application logs.
Website: https://grafana.com/oss/loki/
6. Elastic Stack
The Elastic Stack provides tools for collecting, searching, analyzing, and visualizing logs and other data.
It is commonly used for centralized logging and application troubleshooting.
Website: https://www.elastic.co/
Quick comparison
| Tool | Primary purpose |
|---|---|
| Prometheus | Metrics collection |
| Grafana | Dashboards and visualization |
| OpenTelemetry | Telemetry instrumentation and export |
| Jaeger | Distributed tracing |
| Loki | Log aggregation |
| Elastic Stack | Search and analysis of logs and data |
You don't need every tool in every project.
Choose tools based on your application size, requirements, infrastructure, and budget.
10. Common Beginner Mistakes
1. Logging everything
Too many logs make important information difficult to find and can increase storage costs.
Better approach: Use appropriate log levels and record meaningful events.
2. Logging sensitive information
Passwords, tokens, and API keys should never appear in application logs.
Better approach: Remove or mask sensitive values before logging.
3. Depending only on average response time
An average can hide slow requests that affect a small percentage of users.
Better approach: Monitor p50, p95, and p99 latency where appropriate.
4. Collecting metrics without understanding them
A dashboard with hundreds of metrics is not automatically useful.
Better approach: Start with request rate, error rate, latency, and resource utilization.
5. Ignoring distributed tracing
In a system with multiple services, application logs alone can make it difficult to follow a request.
Better approach: Use distributed tracing and propagate trace context between services.
6. Creating alerts for everything
Too many alerts create noise and cause important incidents to be missed.
Better approach: Alert on meaningful symptoms and actionable conditions.
7. Treating observability as a development-only feature
Observability becomes especially important after an application is deployed and real users start interacting with it.
Better approach: Design logging, metrics, and tracing into your application from the beginning.
11. Practical Checklist
Before deploying a backend application, consider the following:
Logging
- Use a proper logging library.
- Configure appropriate log levels.
- Include timestamps and useful context.
- Prefer structured logs for production systems.
- Avoid logging sensitive information.
Metrics
- Track incoming request counts.
- Monitor request error rates.
- Measure API response times.
- Monitor CPU and memory usage.
- Track important database and business metrics.
Tracing
- Understand how requests travel through services.
- Use trace IDs and span IDs.
- Instrument important application operations.
- Propagate trace context between services.
- Investigate slow traces and failed spans.
Monitoring
- Create useful dashboards.
- Configure meaningful alerts.
- Test your alerting rules.
- Protect internal observability endpoints.
- Review observability data regularly.
12. Conclusion
Observability is an important part of building reliable backend applications.
As applications become larger and involve multiple services, simply checking whether a server is running is not enough.
Developers need to understand what happened, how the application is performing, and where problems are occurring.
Remember the three pillars:
- Logs: Tell you what happened.
- Metrics: Tell you how the system is performing.
- Traces: Show you how a request travels through the system.
Tools such as Prometheus, Grafana, OpenTelemetry, Jaeger, and Loki help developers collect and analyze this information.
You don't need to implement everything at once. Start with meaningful logs, add useful metrics, and introduce distributed tracing as your architecture grows.
A reliable application isn't just one that works. It's one that you can understand, monitor, and debug when something goes wrong.
Further Reading
- OpenTelemetry Documentation
- Prometheus Documentation
- Grafana Documentation
- FastAPI Documentation
- Python Logging Documentation
- Jaeger Documentation
Keep building, keep monitoring, and make your applications observable.