Debugging an Unreproducible Bug: A Practical Guide for Developers
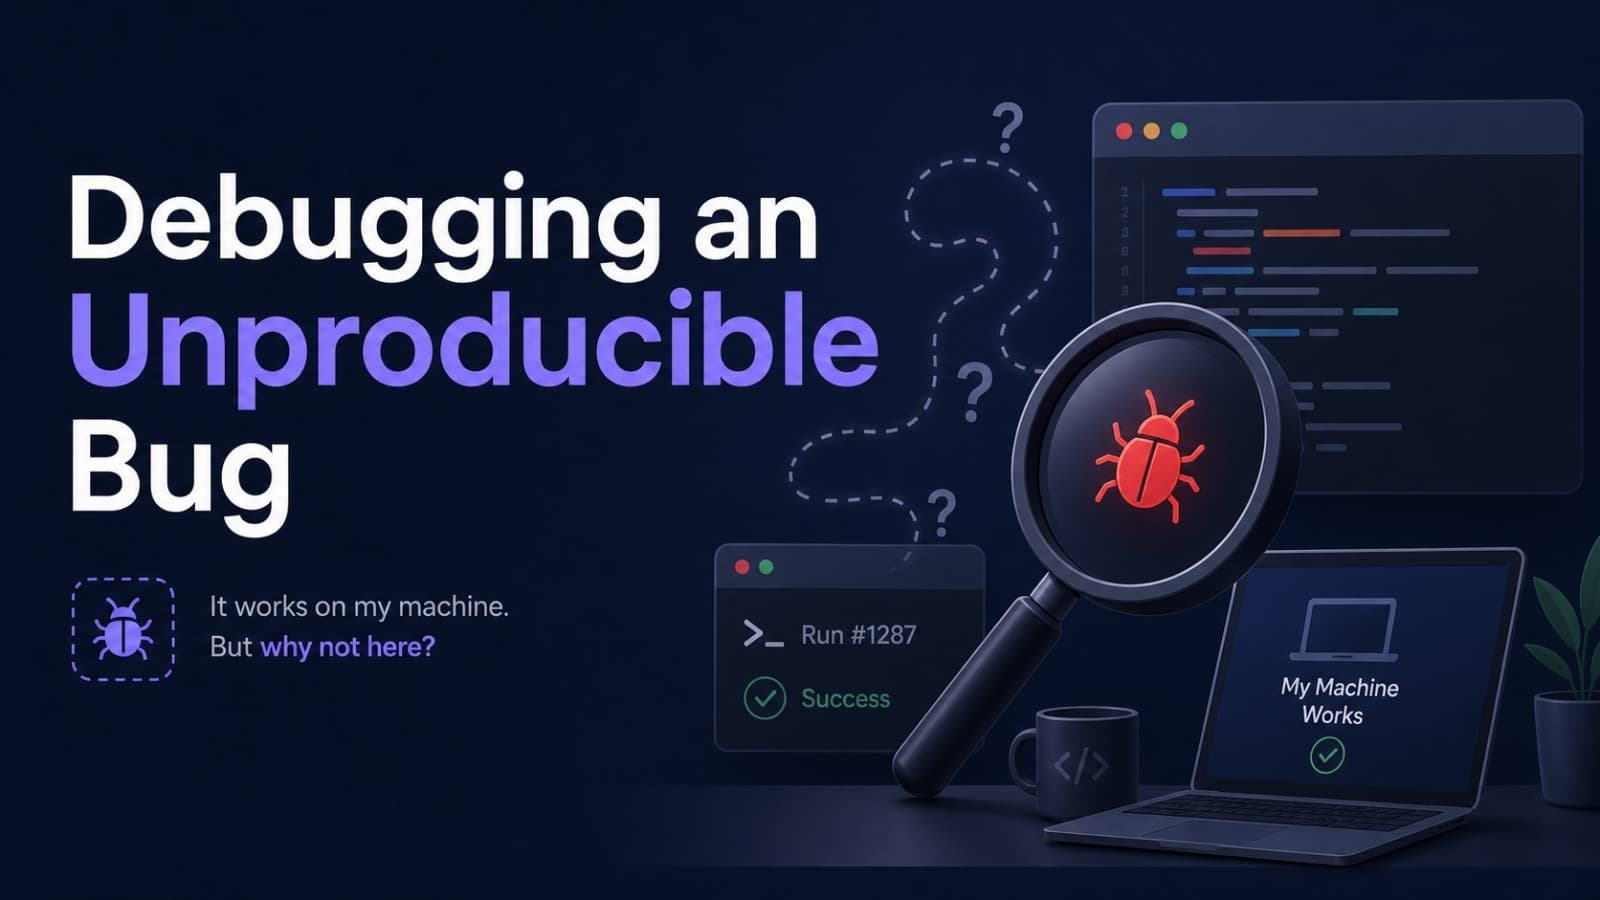
Debugging an Unreproducible Bug: A Practical Guide for Developers
You've built a feature, tested it several times, and everything works perfectly.
Then a user reports:
"Sometimes the app crashes when I click the button."
You try the same steps on your machine. Nothing happens.
You restart the application, test again, and everything still works.
But the user continues experiencing the issue.
Welcome to one of the most frustrating parts of software development: debugging an unreproducible bug.
Some bugs happen only under specific conditions. They may depend on network speed, device configuration, timing, user actions, application state, or production data.
In this article, we'll learn how to investigate these bugs systematically instead of randomly changing code and hoping the problem disappears.
We'll use examples from JavaScript, React Native, and backend applications.
1. What Is an Unreproducible Bug?
An unreproducible bug is a software problem that cannot be consistently triggered using the same steps.
For example:
- A mobile application crashes only sometimes.
- An API occasionally returns a 500 error.
- A button works on one device but not another.
- A payment succeeds, but the order status remains pending.
- A screen displays outdated information after navigation.
- A request fails on slow networks but works on fast networks.
The difficult part is that the bug may disappear when you try to investigate it.
A simple example
Imagine a React Native application with a login button.
A user reports that pressing the button sometimes does nothing.
You test the same feature:
Open application
Enter email
Enter password
Press Login
It works every time on your device.
But the user still experiences the problem.
Why?
Perhaps the issue happens only when:
- The internet connection is unstable.
- The user presses the button multiple times.
- The authentication server responds slowly.
- The application is running on an older device.
- The application is resumed from the background.
The same feature can behave differently under different conditions.
Important: A bug that you cannot reproduce is still a real bug. The absence of a failure during your test does not prove that the application is correct.
2. Why Do Some Bugs Appear Randomly?
Software applications depend on many things working together.
A mobile application might communicate with a backend, which communicates with a database and several external services.
A problem in any of these components can affect the final result.
Let's understand some common causes.
1. Network conditions
Network requests do not always complete at the same speed.
A request might take:
Fast network:     200 ms
Average network:  900 ms
Slow network:    4000 ms
If your application assumes that every request will complete quickly, problems can occur on slower connections.
2. Race conditions
A race condition occurs when the result of an operation depends on the timing or order of concurrent operations.
For example, two API requests update the same application state.
The request that finishes last might overwrite newer data with older data.
3. Different environments
Your local environment may differ from production.
Differences can include:
- Operating system versions.
- Runtime versions.
- Environment variables.
- Database contents.
- API configurations.
- Dependency versions.
4. Application state
Sometimes the application reaches a state that you didn't consider.
For example:
- The user is logged out in another browser.
- A token has expired.
- A screen is using outdated data.
- A request is still running after the user leaves the screen.
5. Resource limitations
A feature may work on your development laptop but fail on a device with limited memory or processing power.
This is especially important for mobile applications.
Summary
| Cause | Example |
|---|---|
| Network | Request timeout |
| Timing | Race condition |
| Environment | Production configuration differs |
| State | Expired authentication token |
| Resources | Memory pressure |
| Data | Unexpected or incomplete database record |
Understanding possible causes helps you investigate the right areas instead of changing unrelated code.
3. The Right Debugging Mindset
A common beginner mistake is immediately changing code after receiving a bug report.
This can make the problem harder to understand.
Instead, follow a systematic process.
Scroll to zoom · Drag to pan
The most important rule is:
Don't guess the solution before understanding the problem.
A good developer tries to find evidence that explains the failure.
4. Step 1: Collect Information Before Changing Code
When someone reports a bug, don't immediately ask them to reinstall the application.
First, understand what actually happened.
Ask questions such as:
- What were you doing when the issue occurred?
- What did you expect to happen?
- What happened instead?
- Does it happen every time or occasionally?
- Which device and operating system are you using?
- Were you connected to Wi-Fi or mobile data?
- Did you see an error message?
Example bug report
A poor report:
The app is not working.A useful report:
Feature: Login

Device: Android 14
Network: Mobile data

Steps:
1. Open the application.
2. Enter valid credentials.
3. Press Login twice quickly.

Expected:
User should navigate to the dashboard.

Actual:
A loading indicator appears indefinitely.

Frequency:
Happens approximately 2 out of 10 attempts.
The second report gives you something to investigate.
Record the environment
For a mobile application, useful information includes:
- Device model.
- OS version.
- Application version.
- Build type.
- Network type.
- Time of occurrence.
For a backend, useful information includes:
- Application version.
- Runtime version.
- Server environment.
- Request method and endpoint.
- HTTP status code.
- Timestamp.
- Relevant request or trace ID.
Avoid collecting unnecessary personal information or sensitive credentials.
5. Step 2: Check Logs and Error Messages
Logs are often the first place to investigate a problem.
Instead of relying on what a user remembers, inspect what the application recorded when the issue occurred.
Example: Bad logging
console.log("Something went wrong");This message doesn't tell us much.
Which operation failed? Which endpoint was involved? What was the error?
Better logging
try {
  const response = await fetch("/api/orders");

  if (!response.ok) {
    throw new Error(`Request failed: ${response.status}`);
  }

  const data = await response.json();

  return data;
} catch (error) {
  console.error("Failed to fetch orders", {
    message: error.message,
    timestamp: new Date().toISOString(),
  });

  throw error;
}
Now the log provides more context.
In production applications, use a logging system that supports structured data, consistent severity levels, and centralized collection.
Logs should answer useful questions
A useful log entry should help you understand:
- What operation was running?
- When did it happen?
- Which component was involved?
- Did it succeed or fail?
- What error occurred?
For backend applications, include a request ID or trace ID whenever possible.
This helps you connect events belonging to the same request.
Security reminder: Never log passwords, access tokens, API secrets, or sensitive user data.
6. Step 3: Investigate Network Problems
Network issues are a common source of intermittent bugs, particularly in mobile applications.
A request can fail because:
- The device loses internet connectivity.
- The server is temporarily unavailable.
- A request takes too long.
- The connection is interrupted.
- The server returns an unexpected response.
Example: Request without timeout handling
async function getOrders() {
  const response = await fetch("/api/orders");

  return response.json();
}
This example does not define an explicit request timeout or handle unsuccessful HTTP status codes.
A more robust approach uses AbortController:
async function getOrders() {
  const controller = new AbortController();

  const timeout = setTimeout(() => {
    controller.abort();
  }, 10000);

  try {
    const response = await fetch("/api/orders", {
      signal: controller.signal,
    });

    if (!response.ok) {
      throw new Error(`HTTP error: ${response.status}`);
    }

    return await response.json();

  } finally {
    clearTimeout(timeout);
  }
}
This example adds a 10-second timeout.
Remember that a timeout doesn't necessarily mean the server never processed the request. For operations such as payments or order creation, blindly retrying can create duplicate actions.
Use idempotency keys and appropriate retry strategies for operations that must not execute more than once.
Check network activity
When debugging a network-related problem, inspect:
- Request URL.
- HTTP method.
- Request headers.
- Request body.
- Response status.
- Response body.
- Request duration.
- Timeout and cancellation behavior.
For React Native applications, tools such as React Native DevTools and suitable network inspection tools can help investigate requests.
7. Step 4: Look for Race Conditions
Race conditions are especially frustrating because the same code can work perfectly on one attempt and fail on another.
Consider this example:
let user = null;

async function loadUser() {
  user = await fetchUser();
}

function showDashboard() {
  console.log(user.name);
}
Imagine showDashboard() runs before loadUser() finishes.
The application may try to access name on null.
The problem is not necessarily that fetchUser() is incorrect.
The problem is that the code assumes the data will be available before it is actually loaded.
Visualize the problem
Scroll to zoom · Drag to pan
A better implementation
async function openDashboard() {
  try {
    const user = await fetchUser();

    if (!user) {
      throw new Error("User not found");
    }

    showDashboard(user);

  } catch (error) {
    console.error("Unable to open dashboard:", error);
  }
}
Now the dashboard is opened only after the user data has been loaded.
Another common race condition: Search requests
Imagine a search box.
A user types:
R
Re
Rea
React
The application sends four requests.
If the first request takes longer than the last request, its response may arrive later and overwrite the results for "React".
This can display outdated search results.
A common solution is to cancel the previous request or ignore responses that are no longer relevant.
let currentController;

async function searchProducts(query) {
  currentController?.abort();

  const controller = new AbortController();
  currentController = controller;

  try {
    const response = await fetch(
      `/api/products?q=${encodeURIComponent(query)}`,
      { signal: controller.signal }
    );

    if (!response.ok) {
      throw new Error("Search failed");
    }

    return await response.json();

  } catch (error) {
    if (error.name === "AbortError") {
      return null;
    }

    throw error;
  }
}
This example cancels the previous search request before starting another one.
For production applications, also consider request identity, component lifecycle, and the behavior of your data-fetching library.
8. Step 5: Investigate State and Timing Issues
Some bugs are caused by unexpected application state.
For example, a user might:
- Open the profile screen.
- Start loading profile data.
- Navigate to another screen.
- Return to the profile screen.
- Receive an old response from the earlier request.
If the application doesn't handle the lifecycle correctly, outdated information may overwrite newer state.
React example
Consider this simplified component:
useEffect(() => {
  fetchUser(userId).then(setUser);
}, [userId]);
There is a potential problem: an earlier request may finish after the component has started loading data for another user.
A safer approach uses cancellation:
useEffect(() => {
  const controller = new AbortController();

  async function loadUser() {
    try {
      const response = await fetch(
        `/api/users/${userId}`,
        { signal: controller.signal }
      );

      if (!response.ok) {
        throw new Error("Unable to fetch user");
      }

      const data = await response.json();
      setUser(data);

    } catch (error) {
      if (error.name !== "AbortError") {
        console.error(error);
      }
    }
  }

  loadUser();

  return () => {
    controller.abort();
  };
}, [userId]);
The cleanup function cancels the previous request when the effect is cleaned up.
Test different timing conditions
Try testing your application under:
- Slow network conditions.
- Rapid button presses.
- Repeated navigation.
- Application background and foreground transitions.
- Expired sessions.
- Delayed API responses.
A bug that doesn't appear under normal conditions may become visible when you deliberately change the timing.
9. Step 6: Reproduce the Production Environment
A common reason bugs cannot be reproduced locally is that development and production environments are different.
For example:
| Development | Production |
|---|---|
| Local database | Managed database |
| Debug build | Release build |
| Fast local network | Real user network |
| Test accounts | Real user accounts |
| Debug logging | Production logging |
| Development configuration | Production configuration |
What should you compare?
Check:
Runtime versions
Is production running the same Python, Node.js, or JavaScript runtime version?
Dependencies
Are the installed package versions consistent?
Environment variables
Are database URLs, API endpoints, and configuration values correct?
Build configuration
Are debug and release builds behaving differently?
Data
Does production contain data that your local test environment doesn't?
Example: Environment-specific behavior
Imagine your application works locally but fails in production.
You discover that the production API uses:
https://api.example.comBut the application was configured to call:
http://localhost:8000The development application works because the backend is running locally.
The production application cannot use your development machine's localhost address to reach the production backend.
This is why configuration should be managed carefully across environments.
10. Step 7: Use Error Tracking and Monitoring
Sometimes users experience a bug without reporting it.
You cannot investigate what you don't know exists.
This is where error tracking and monitoring tools become useful.
What is error tracking?
Error tracking platforms collect application errors and group similar failures together.
They can provide information such as:
- Error messages.
- Stack traces.
- Application versions.
- Device and browser information.
- Occurrence frequency.
- User impact, where safely configured.
- Breadcrumbs showing events before the error.
For example, an error tracking dashboard might show:
Error: Cannot read properties of null

Affected releases: 2.1.0
Occurrences: 47
Affected devices: 18

Most common location:
ProfileScreen.js:42
This is much more useful than waiting for someone to send a screenshot.
Popular tools
Sentry
Sentry helps developers track errors and investigate application issues.
It supports multiple platforms, including React Native and Python.
Website: https://sentry.io/
Firebase Crashlytics
Crashlytics helps monitor application crashes and understand stability issues in mobile applications.
Website: https://firebase.google.com/products/crashlytics
Datadog
Datadog provides application performance monitoring, infrastructure monitoring, logs, and distributed tracing.
Website: https://www.datadoghq.com/
OpenTelemetry
OpenTelemetry provides a vendor-neutral way to instrument applications and generate telemetry.
Website: https://opentelemetry.io/
Choose tools according to your application's requirements. You don't need to install all of them.
11. A Practical Debugging Example
Let's put everything together.
Imagine a food delivery application.
A user reports:
"Sometimes my order is created, but the app keeps showing Processing."
You try creating an order on your device. It works correctly.
How would you investigate?
Step 1: Understand the expected behavior
The expected flow is:
Scroll to zoom · Drag to pan
Step 2: Check the logs
You find:
10:30:01 Order creation started
10:30:02 Payment request sent
10:30:05 Payment provider response received
10:30:06 Order status update started
10:30:06 Database timeout
The database timeout gives you an important clue.
Step 3: Inspect the request trace
The trace shows:
Create Order:        120 ms
Payment Request:    2800 ms
Database Update:    5000 ms
Now you know that the database update is taking unusually long.
Step 4: Investigate the database
You discover that the database occasionally becomes overloaded because of long-running queries.
Step 5: Fix and verify
You investigate the query, optimize it, and test under load.
You also review the order workflow to ensure that a successful payment can be reconciled with the order even if the database update temporarily fails.
For payment workflows, use appropriate idempotency, transaction boundaries, and reconciliation mechanisms. A successful payment should not be lost simply because a later operation failed.
What did we learn?
The bug was not in the order button.
It was not necessarily in the frontend.
The actual issue occurred in a backend database operation.
Without logs and traces, a developer might waste hours changing frontend code.
This is why collecting evidence matters.
12. Common Debugging Mistakes
1. Changing multiple things at once
If you change five different parts of your application and the bug disappears, you don't know which change fixed it.
Better approach: Make one controlled change at a time.
2. Ignoring the user's environment
A problem that happens on Android 13 may not happen on your Android 16 device.
Better approach: Collect device, OS, application version, and environment information.
3. Assuming that a successful test proves everything works
A bug may happen only under a particular timing or network condition.
Better approach: Test edge cases and different execution conditions.
4. Adding random delays
Using setTimeout() to hide a timing issue is not a proper fix.
Better approach: Understand the actual asynchronous dependency and coordinate operations correctly.
5. Swallowing errors
This is dangerous:
try {
  await saveOrder();
} catch (error) {
  // Ignore error
}
The application hides the failure.
Better approach: Handle the error intentionally, log useful context, and communicate the failure to the user.
6. Fixing symptoms instead of root causes
Restarting a service might temporarily solve a problem without explaining why it happened.
Better approach: Investigate the underlying cause and verify that the fix addresses it.
13. A Reusable Debugging Checklist
Whenever you encounter a difficult bug, follow this checklist.
Understand the problem
- Collect the exact error message.
- Record the steps that caused the issue.
- Understand expected vs actual behavior.
- Identify affected devices and environments.
- Determine how frequently the bug occurs.
Investigate
- Check application logs.
- Inspect network requests.
- Review error stack traces.
- Check application state.
- Look for race conditions.
- Compare development and production environments.
- Inspect relevant database operations.
Fix and verify
- Identify the root cause.
- Make a focused code change.
- Add a regression test.
- Test edge cases.
- Verify the fix in a realistic environment.
- Monitor the application after deployment.
14. Conclusion
Debugging an unreproducible bug is not about randomly changing code until the application starts working.
It is about collecting evidence, understanding the environment, identifying possible causes, and testing your assumptions.
Remember these principles:
- Collect information before making changes.
- Use logs to understand what happened.
- Inspect network requests and application state.
- Look for race conditions and timing issues.
- Reproduce production conditions whenever possible.
- Use error tracking and observability tools.
- Fix the root cause instead of hiding the symptom.
As applications grow, debugging becomes an essential engineering skill.
Good developers write code that works. Great developers also know how to investigate when it doesn't.
Further Reading
- Sentry Documentation
- React Native Debugging
- Chrome DevTools Documentation
- OpenTelemetry Documentation
- Firebase Crashlytics
- Python Logging Documentation
Keep investigating, follow the evidence, and never stop at the first symptom.